 |
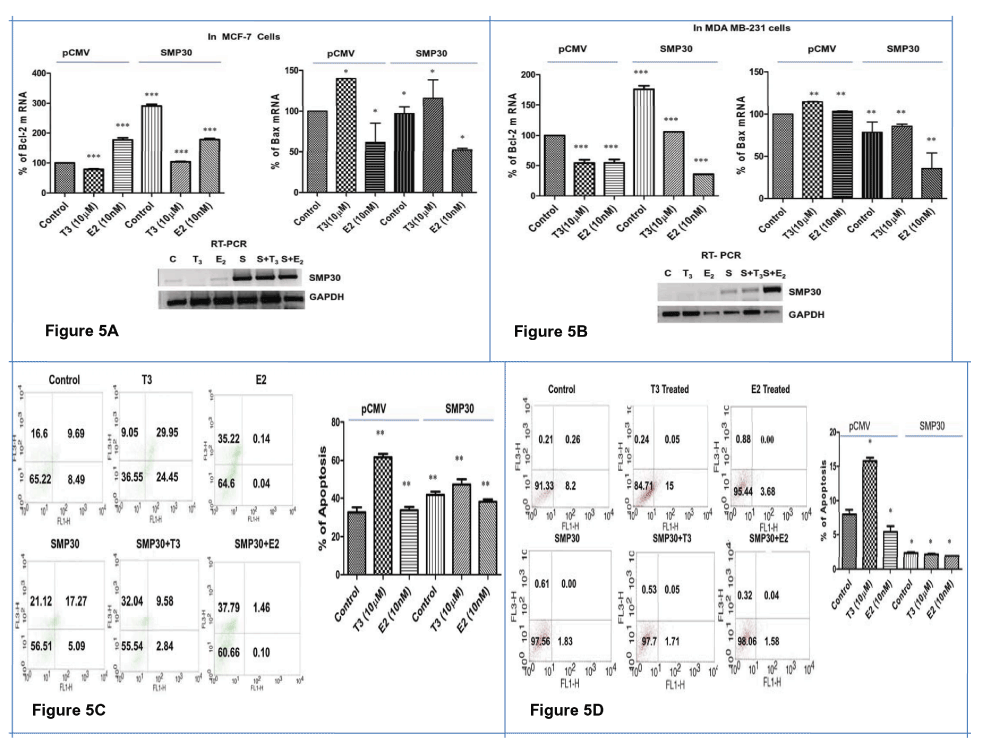
| Figure 5: Induction of apoptosis as a result of T3 Mediated repression of hSMP 30 in contrast to absence of any significant induction of apoptosis as result of E2 mediated repression of hSMP 30. (A,B) A representative qRT-PCR data for two apoptotic related genes BCL-2 and BAX expression in MCF-7 and MDA MB-231 cells. Shown are the mean of triplicate samples (mean ± SD) normalized to GAPDH. CT values obtained from the real time PCR was used to compare the expression label of treated sample from control assuming 100% amplification. Results were confirmed in three independent experiments. P<0.0001 difference from only vector transfected control using ANOVA for BCL-2 gene, P<0.0232 difference from control using ANOVA for BAX gene expression in MCF-7 cells. P<0.0001 difference from only vector transfected control using ANOVA for BCL-2 gene, P<0.001 difference from control using ANOVA for BAX gene expression in MDA MB-231 cells. Over expression of SMP30 gene after transfection has been confirmed by RT-PCR. SMP30 gene in (upper panel) and GAPDH gene in (lower panel) are shown using cDNA from MCF-7 and MDA MB-231 cells. (C,D) Apoptosis was assessed post vector/SMP30 cDNA transfection and E2/T3 treatment by flow cytometry. Shown are the mean of triplicate samples ± SD normalized to control. Similar findings were found in two other experiments, P < 0.001 difference from only vector transfected control using ANOVA in Figure 5C and P < 0.01 difference from only vector transfected control using ANOVA in Figure 5D. |