|
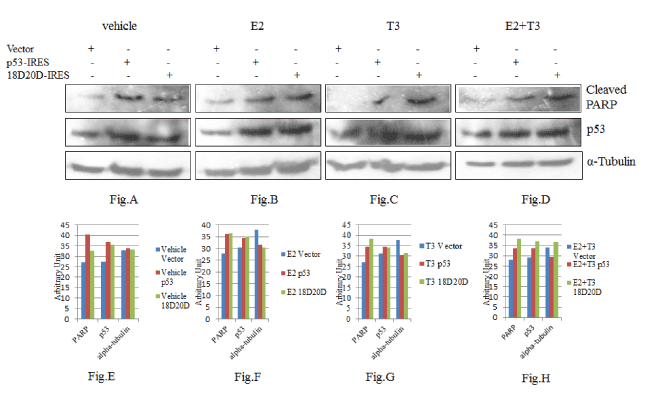
| Figure 6: Western Blots showing effect of p53/phosphorylated p53 (p53-18D20D) over PARP under E2/T3 treatment. Figures 6A, B, C, D: Western Blots of vehicle treated (5A), 10 nM E2 treated (5B), 10 nM T3 treated (5C), 10 nM E2+10 nM T3 treated (5D) 50 µg MCF-7 whole cell lysates; cleaved PARP (amino terminal) was detected at 24 kDa; p53 was detected at 53 kDa; alpha-tubulin was used as loading control. Figures 6E, F, G, H: Bar diagrams for Figures 5A, B, C, D respectively representing densitometric analysis performed with Biorad Quantity One software. |