|
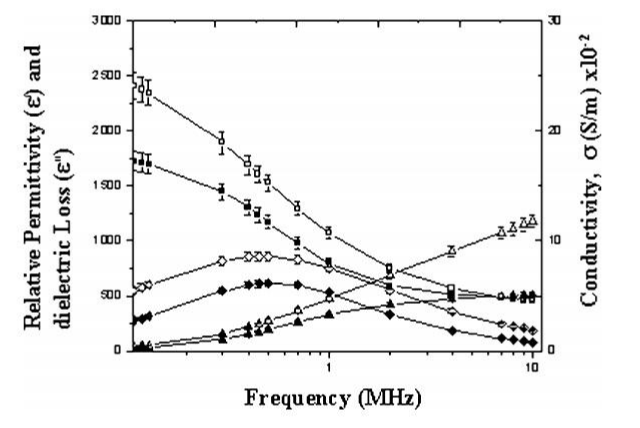
| Figure 4: The variation of the relative permittivity є’ (■), dielectric loss ἕ (•) (left scale) and the electric conductivity σ (▲) (right scale) as a function of the applied frequency in the range of 0.1–10 MHz for DNA suspension of control group (solid symbol), and for DNA suspension of malignant group (hollow symbol). |