|
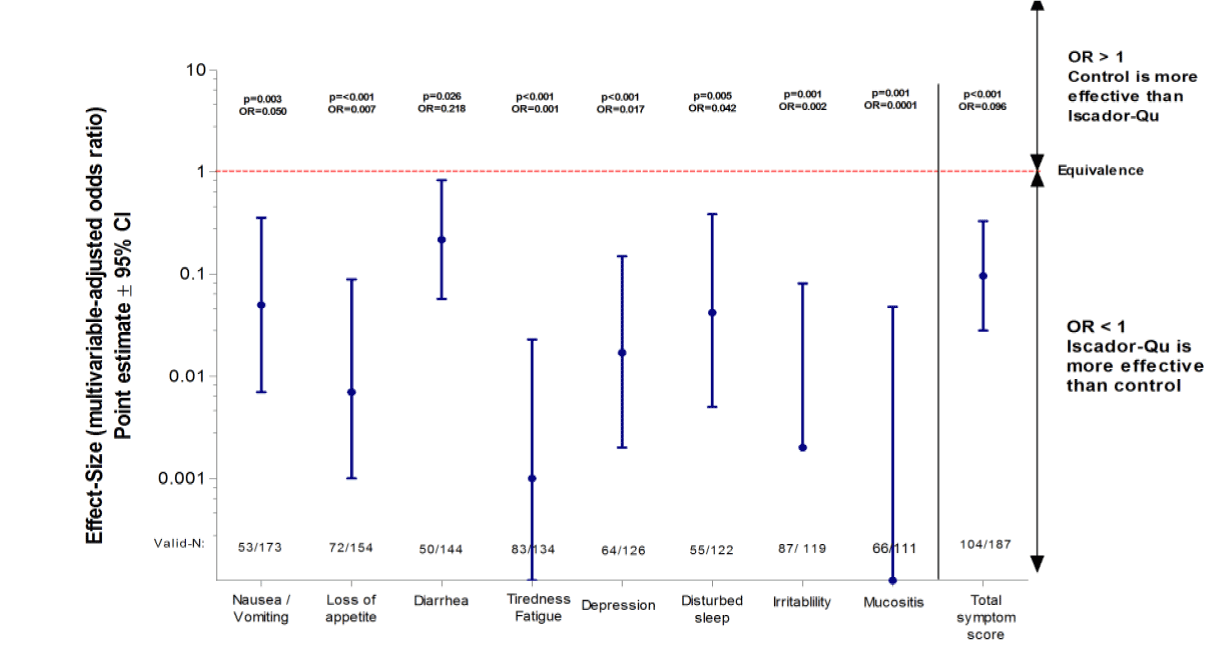
| Figure 2: Detailed symptom persistence analysis after a median 5 months therapy course. The x-axis nominates the single symptoms and the total number of patients evaluated with the different symptoms. The logarithmic y-axis nominates the multivariable-adjusted odds ratios (OR). The dots show the OR point estimates and the bars the 95% confidence intervals of OR. |