 |
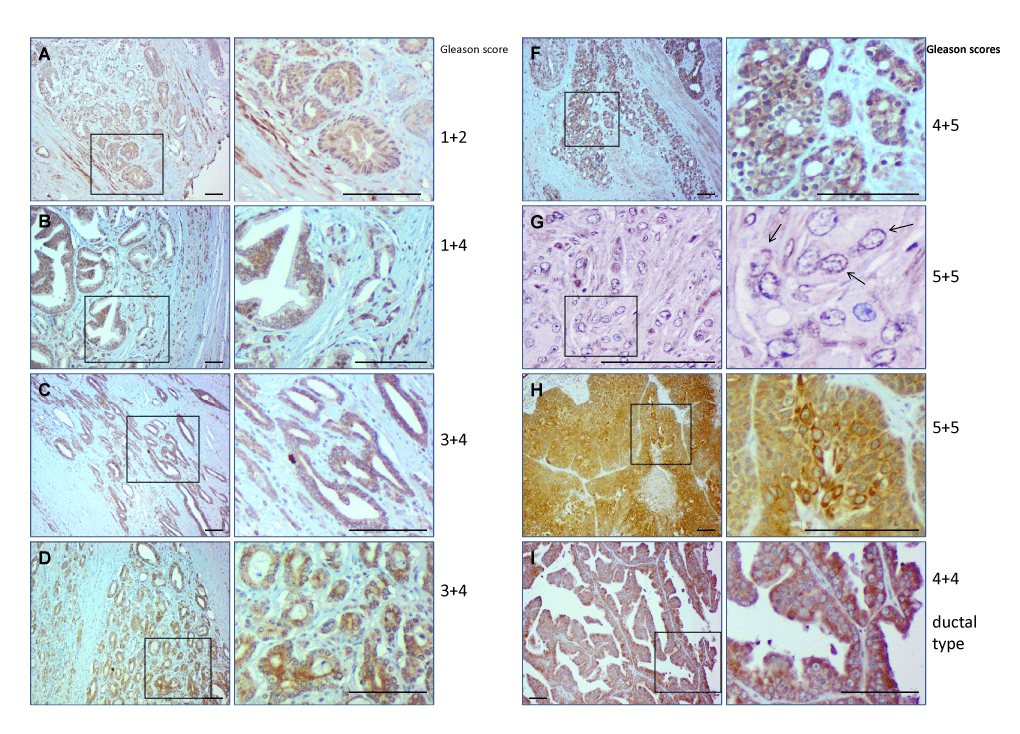
| Figure 5: Expression of SGLT1 in PCa tissue representing different grades (Gleason scores). A-I, SGLT1-positive cells appear brown. Arrows in G, indicate SGLT1-positive nuclear envelopes. Right panels are magnification of boxed areas in left panels. Bar=50 μm. |