 |
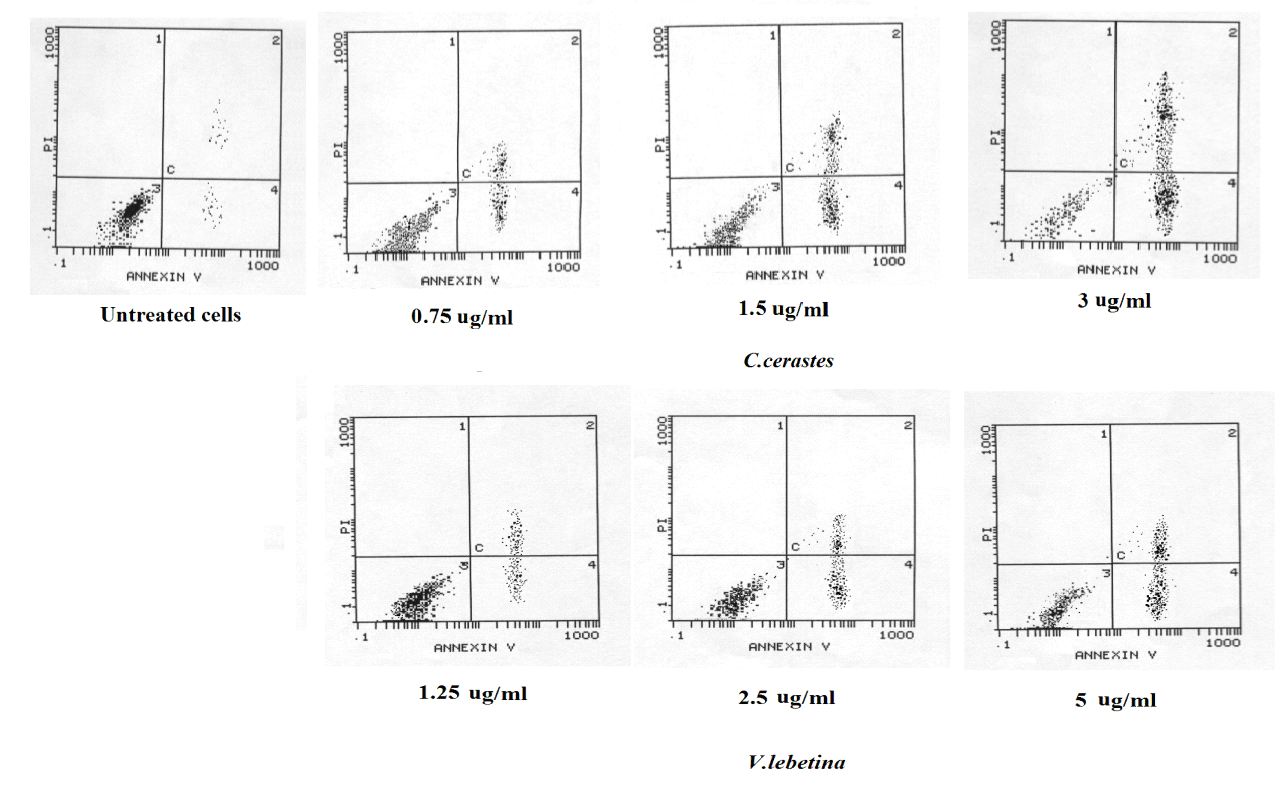
| Figure 4: Flow cytometric analysis post 24 h treatment of MCF-7 cells with different concentrations of C.cerastes and V.lebetina venoms compared to untreated cells control using combined annexin-V and propidium iodide dyes. Data was presented in two-dimensional dot plots, where the regions of early, late apoptotic and viable cells were separated depending on fluorescence intensity. The number of early and late apoptotic cells significantly increased relatively to test venoms concentrations, whereas the number of viable cells was significantly decreased at P<0.05. C2: late apoptotic; C3: viable cells; C4: early apoptotic. |