 |
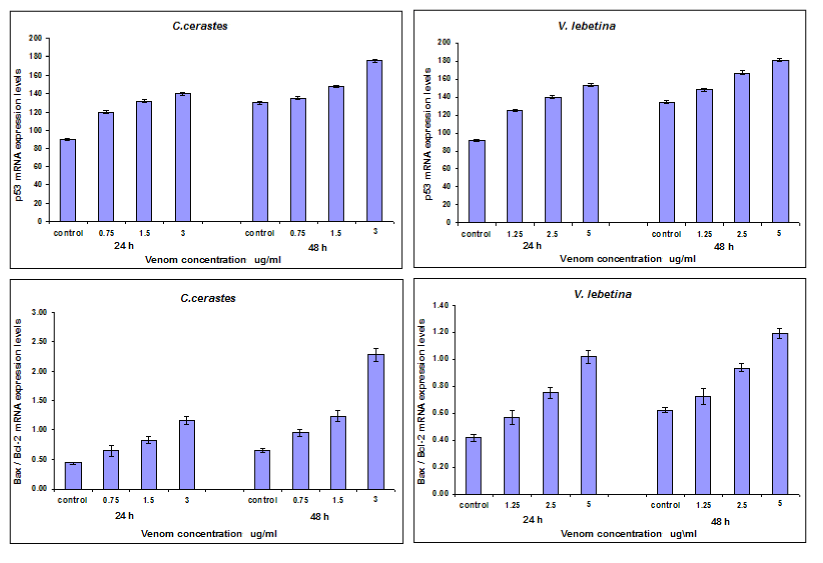
| Figure 5b: Denstiometric evaluation of p53 and Bax\Bcl-2 mRNA expression levels 24 and 48 h post MCF-7 cells treatment with different concentrations of C.cerastes (0.75, 1.5 & 3 μg/ml) and V.lebetina (1.25, 2.5 & 5 μg/ml) venoms revealing statistically significant increase in p53 as well as in Bax\Bcl-2 mRNA expression levels compared to their levels in untreated cells at P<0.5. Error bars represent mean ± SD of triplicates. |