|
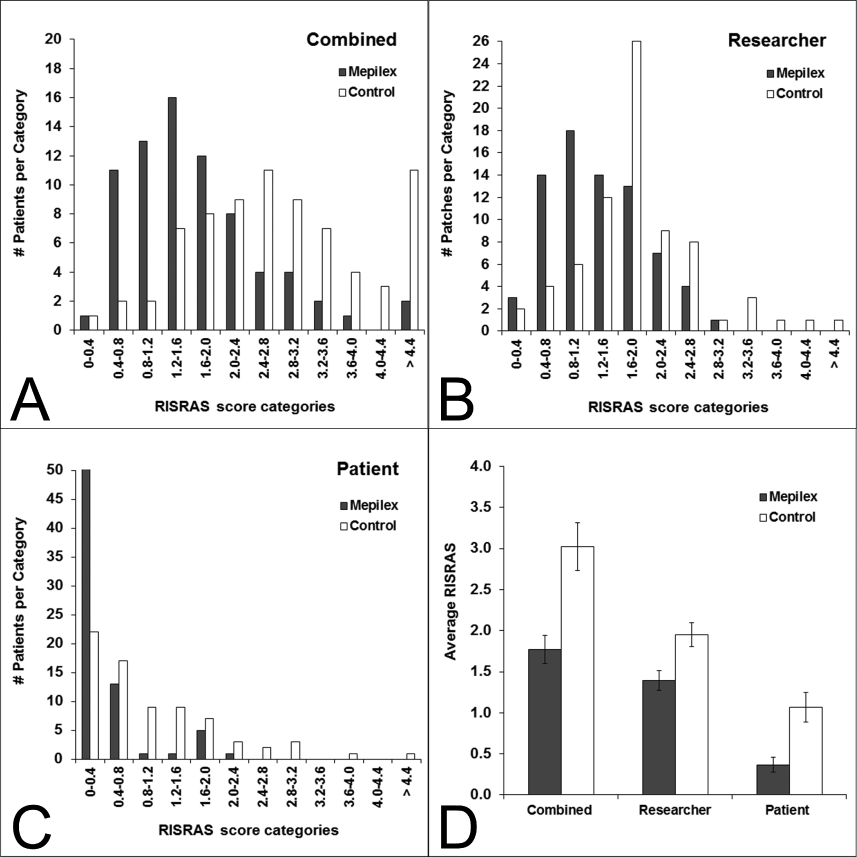
| Figure 2: Distribution of Radiation-Induced Skin Reaction Assessment Scale (RISRAS) scores in categories. (A-C) and averaged over all trial patients (D). A-C: RISRAS scores of skin areas were grouped into categories and displayed as total number of skin areas per category, showing an overall normal distribution for the combined and researcher scores but not for the patient scores. D. RISRAS scores broken down in separate components and presented as mean values ± SEM of 74 skin patches. Statistical significance of difference between dressings and cream was <0.001 using a two-tailed paired t-test for combined and researcher scores and Wilcoxon signed rank test for patient scores. |