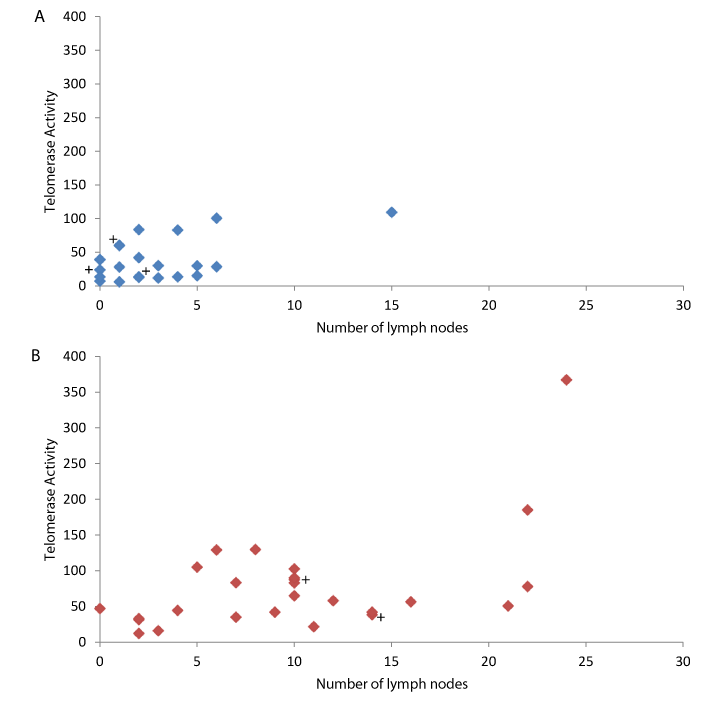
| Figure 4: Scatter plot describes the positive correlation between telomerase activity and lymph node metastases where each dot represents one patient. (A) In non IBC (the correlation was mild positive (r=0.54) and the P value was 0.01*) and (B) In IBC (the correlation was mild positive (r=0.53) and the P value was 0.004*). The correlation was made for 25 of 26 IBC and 22 of 27 patients whose clinical data was available; some patients’ samples had the same telomerase activity and so they were presented with the same dot on the scatter plot. |
 * Indicates significant p value
+ indicates two overlapped points
* Indicates significant p value
+ indicates two overlapped points