 |
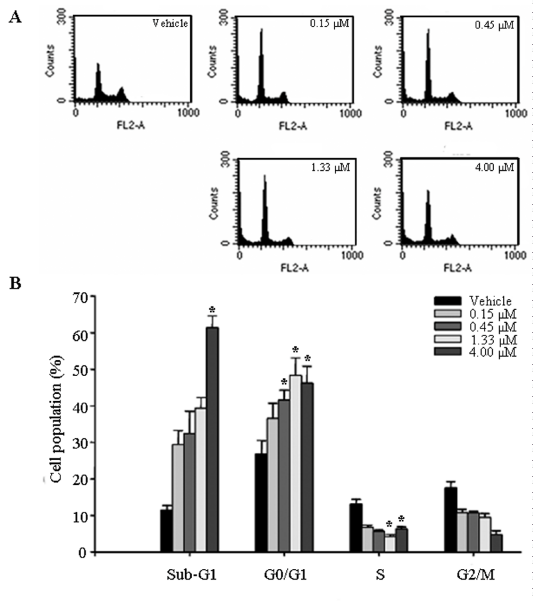
| Figure 1: Cell cycle analysis on salinomycin-treated PC-3 cell. (A) Cell cycle arrest. (B) The percentages of cells in each cell cycle phase. Cells were exposed to increasing concentrations (0-4.00 μM) of salinomycin for 48 h. After treatment with salinomycin, the cells were fixed with ice-cold 70% ethanol at -20°C and then stained with propidium iodide (1 mg/ml), followed by flow cytometery analysis to determine DNA contents. The figures show a representative staining profile for 10,000 cells per experiment. Data are presented as mean ± SD (n = 3, each group). *p< 0.05 vs. control group. |