 |
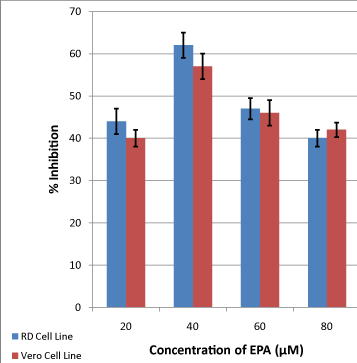
| Figure 1: Effects of different concentrations of EPA on viability of RD and Vero cells (P ≤ 0.05). Data was compared, using Student’s T-test, with those obtained from control samples where cell viability was studied without adding omega-3 fatty acids. Error bars represent confidence limits at 95% confidence level. |