 |
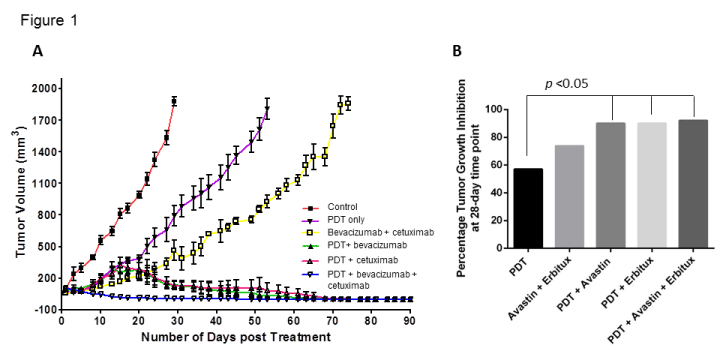
| Figure 1: (A): Tumor volumes were charted against days to assess the tumor response in various treatment groups. The combination therapy groups of PDT + bevacizumab, PDT + cetuximab and PDT + bevacizumab + cetuximab exhibited greater tumor response in comparison with other groups. Each group represents the mean (error bars, SE) of 10 animals. (B) Percentage tumor growth inhibition was determined for each treatment group against control at 28 day time point by using the formula, tumor growth control = (Vc-Ve/Vc) ×100, where Vc is the average tumor volume in control groups and Ve is the average tumor volume in the experimental groups. |