 |
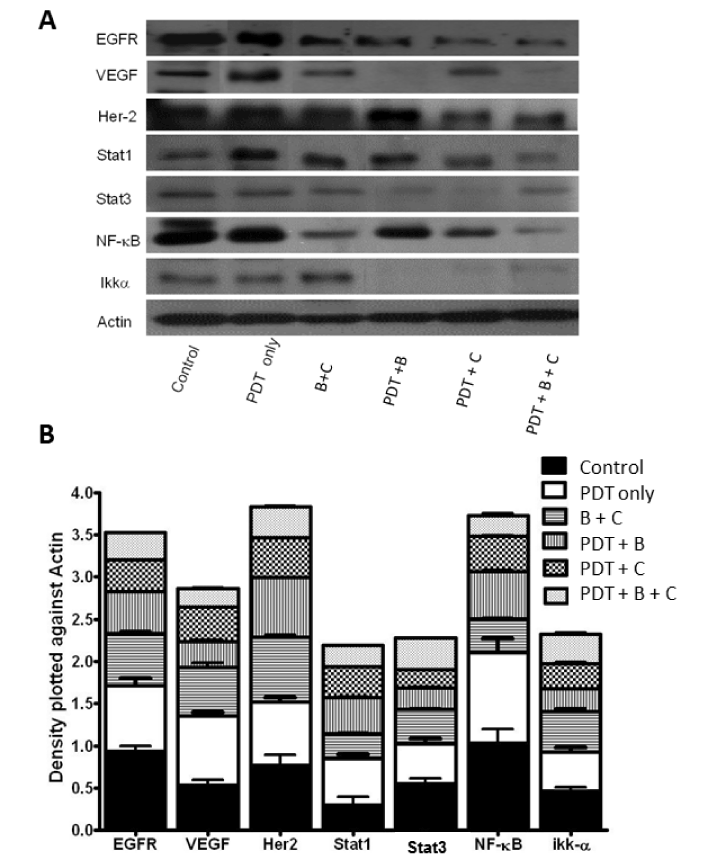
| Figure 4: (A): Expression of EGFR, VEGF, Her-2, Stat1, Stat3, NF-κB, Ikkα was detected in the treatment groups using western immunoblot analysis. Expression of actin was used to monitor protein loading, (B) Graph showing the intensity of bands plotted against Actin. |