|
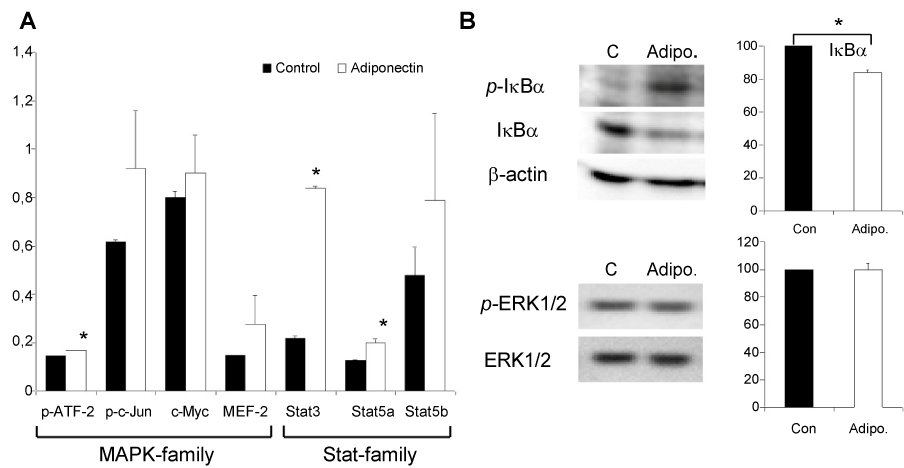
| Figure 2: Regulation of transcription factors. In A, the graphs show mean intensities and standard deviation of the measured optical density (450 nm) of control cells (black) and adiponectin-treated cells (white) of three independently performed experiments. We used the Student’s t-test to calculate statistical significance; changes with a p-value ≤ 0.02 are marked by an asterisk. B, immunoblots of total and phosphorylated IκBα and Erk1/2 in SW480 cells after incubation with adiponectin for 15 minutes. β-Actin was used as standard to adjust the applied protein amounts. The graphs show mean values and standard deviation of four independent experiments. Changes with a p-value = 0.0001 are marked by an asterisk. |