|
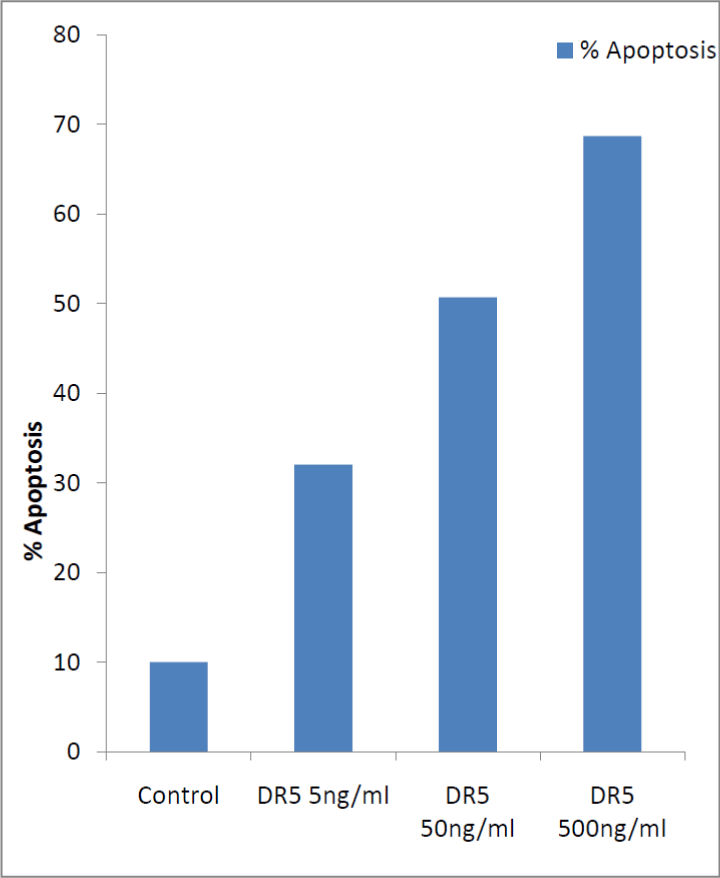
| Figure 21: Effect of DR5 on PC3 cells. This graph depicts % apoptosis based on varying concentrations of DR5 on PC3 cells. These PC3 cells were incubated for 24 hours after addition of varying concentrations of DR5 and stained to check for the percentage of apoptotic cells. |