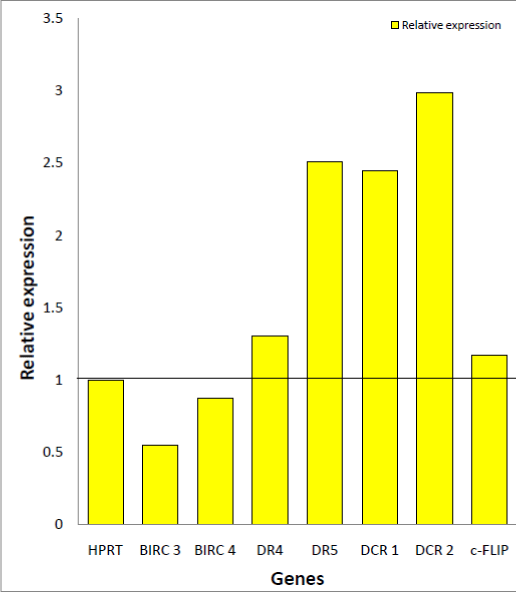
Figure 48:
Graph showing the effect of 1nM B leptomycin on the change in gene expression of a specific set of genes related to apoptosis in PC3 cells using 2
-ΔΔCt
values.