|
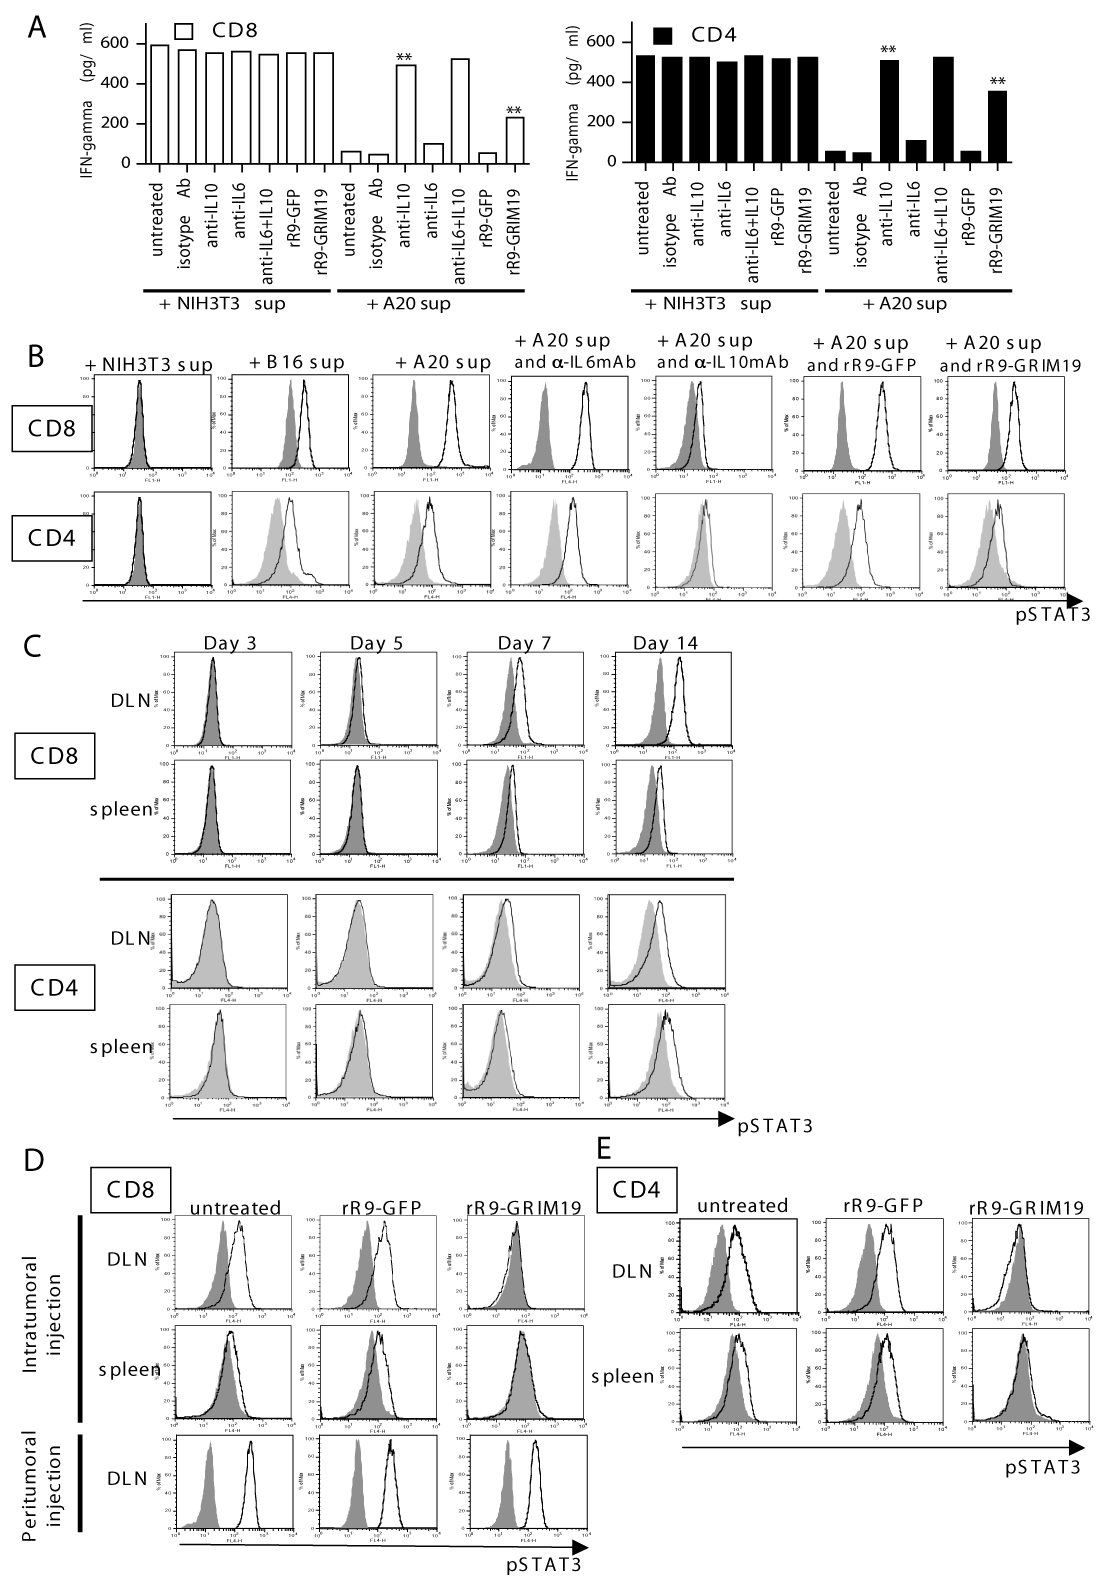
| Figure 4: Analyses of pSTAT3 expression in CD8+ or CD4+ T cells. (A): In vitro suppressive function by A20-conditioned supernatant on IFN-γ-production in CD8+ (left panel) or CD4+ T cells (right panel). Purified T cells from naïve mice were co-cultured for 24 h with medium containing NIH3T3-conditioned or A20-conditioned supernatant and PMA plus ionomycin in the absence or presence of anti-IL-6, anti-IL-10 neutralizing mAbs (100 ng/ml), or rR9-fusion protein (rR9-GFP or rR9-GRIM19; 1 μg/ml). Data are representative of two individual experiments. Data from only one representative experiment are shown. (** p < 0.01). (B): pSTAT3 expression in CD8+ or CD4+ T cells purified from naïve mice following 12 h of cultivation in medium containing NIH3T3-conditioned, B16-conditioned, or A20-conditioned supernatant; cells were cultured in the absence or presence of a rR9-fusion protein (rR9-GFP or rR9-GRIM19; 1 μg/ml), anti-IL-6 neutralizing, or anti-IL-10 neutralizing mAb (100 ng/ml). Expression of pSTAT3 was analyzed by flow cytometory using anti-pSTAT3 mAb. Gray lines represent isotypeIgG. Data are representative of threeindividual experiments. Data from only one representative experiment is shown. (C): In vivo kinetics of pSTAT3 expression in CD8+ or CD4+ T cells from DLNs or spleen after inoculation of A20 cells into abdominal skin on day 0. Expression of pSTAT3 was analyzed using anti-pSTAT3 mAb on days 3, 5, 7, and 14. Gray lines represent the control antibody, isotype IgG. Data are representative of three individual experiments. (D, E): Expression of pSTAT3 in CD8+ or CD4+ T cells from DLNs or spleen following intratumoral (or peritumoral) injections of rR9-fusion proteins daily for three days (9-11); data was collected on day 16. Gray lines, isotype IgG. Data are representative of five individual experiments. |