|
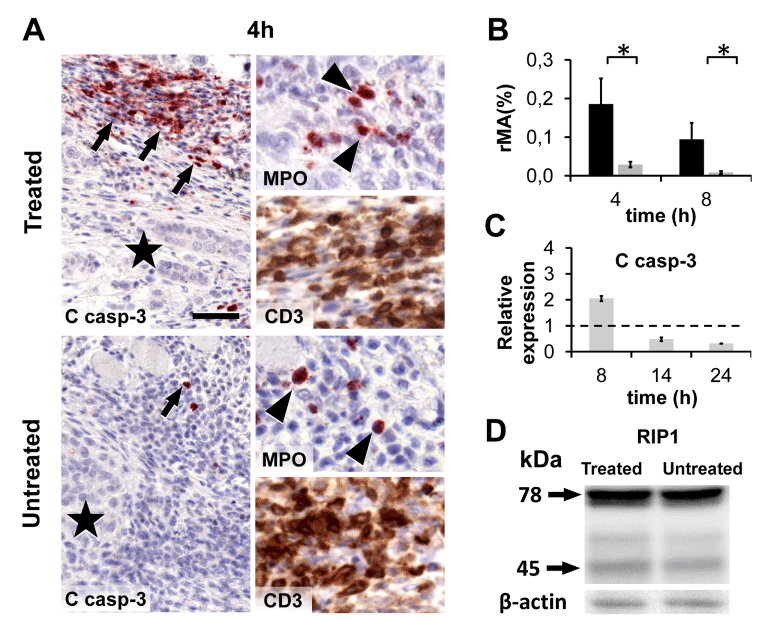
| Figure 6: Expression of caspase-3 protein in mEHT treated HT29 xenografts. A) Though treated tumors show significantly more cleaved/activated caspase-3 (C casp-3) positive cells than untreated controls (left column; AEC, red), the reaction is primarily localized to peritumoral leukocytes (arrows) and not to tumor nests (asterisks). Caspase positive cells correspond to myeloperoxidase (MPO) positive neutrophil granulocytes/monocytes (AEC, red; arrowheads) and CD3 positive immature T lymphocytes (DAB, brown). Bar indicates 50 μm in the left and 25 μm in the right columns. B) Cleaved caspase-3 positive areas (relative mask area; rMA) measured with the HistoQuant software are significantly higher (*p<0.05) in the treated than in the untreated samples both at 4h and 8h post-treatment. C) Graph showing low cleaved caspase-3 levels measured using apoptosis protein arrays. D) RIP1 kinase expression (either the full length 78 kDa or the 45 kDa cleaved fragment) does not differ significantly in the treated compared to the untreated tumors. |