 |
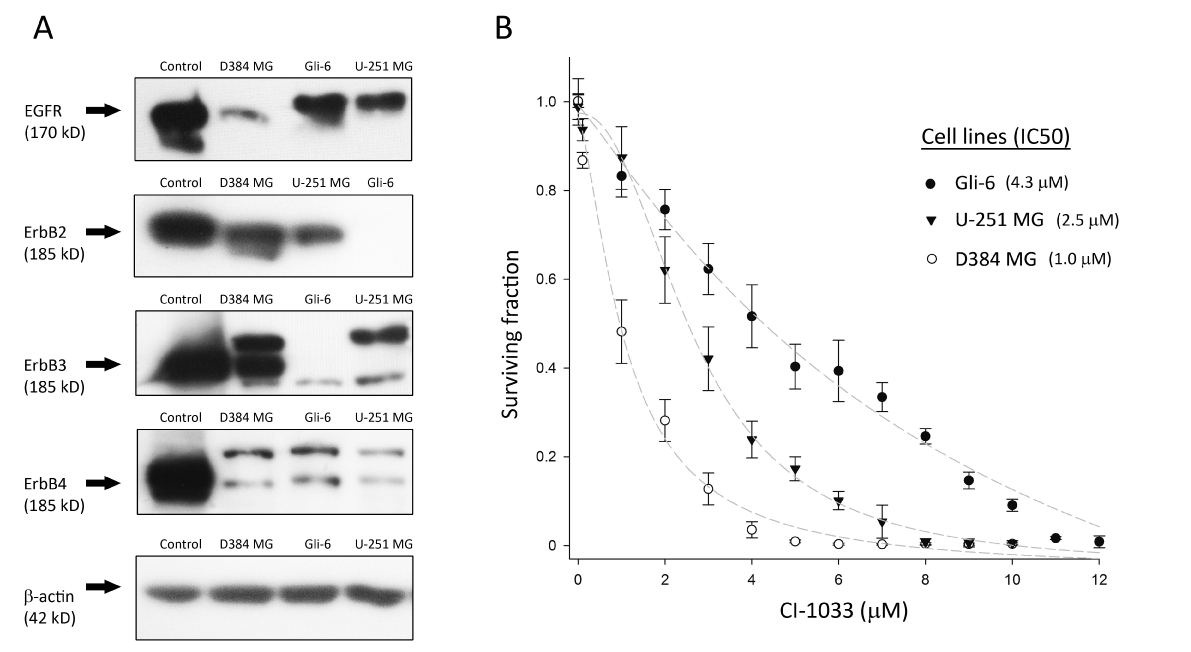
| Figure 2: (A) Immunoblot of baseline EGFR (170 kD), ErbB2 (185 kD), ErbB3 (185kD), ErbB4 (185kD) expression in HGG cell lines and control cell lines (A431, HT-29, Hep-G2, MCF-7 cells respectively). Representative beta actin staining from the ErbB3 immunoblot (42 kD). (B) Cell viability assay for HGG cell lines, exposed to the indicated concentrations of CI-1033 (Canertinib). Cell viability was assayed after 72 hrs exposure. Dots indicate mean values of experiments performed in triplicate. Bars indicate standard deviation of the mean (SD). IC50 values are calculated using Sigma Plot and are indicated between brackets. |