 |
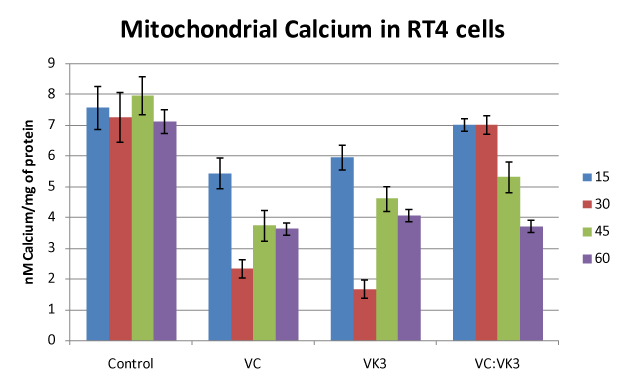
| Figure 4: RT-4 cells were exposed to vitamins 15, 30, 45 and 60 min their CD90 doses, (VC (8,750μM), VK3 (90μM) and VC:VK3 (520μM:5.2μM)) harvested and analyzed for mitochondrial calcium content. Calcium content was assayed using arsenazo III. Data has been expressed as nM Calcium per mg of protein calculated on the basis of a calcium standard curve. Values are the mean ± standard error of the mean of three experiments with three readings per experiment and were compared to the control (P<<0.0022 between treatment and control for all groups by 45-60 minutes). |