|
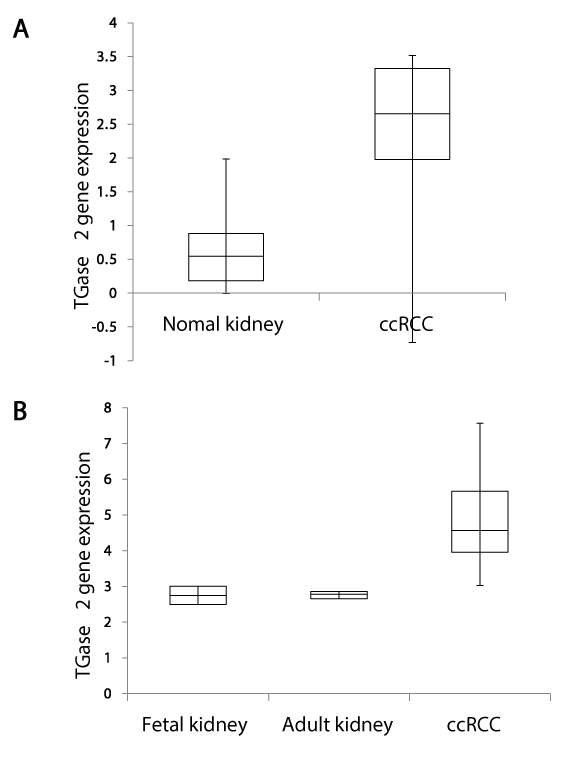
| Figure 1: Expression changes for Transglutaminase 2 gene. (A) Distribution of the expression between 23 normal kidney tissue samples and 23 clear cell renal cell carcinoma samples (on a log2 scale). The statistical significance between normal kidneys and ccRCCsis p-value of 7.83e-10. (B) Distribution of the expression between normal kidney group (two fetal kidneys and three adult kidneys) and 26 clear cell renal cell carcinoma samples (on a log2 scale). The statistical significance between normal kidneys and ccRCCs is p-value of 1.71e-9. |