 |
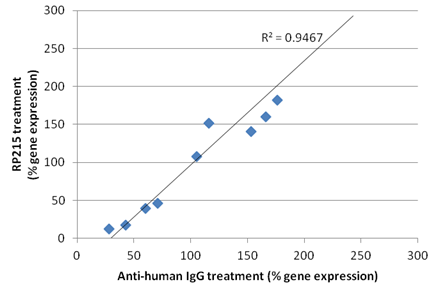
| Figure 2: Correlation analysis of gene regulations of IgG, NFκB-1 and selected TLR genes upon separate treatments with RP215 and antihuman IgG in two cancer cell lines. The data (♦) represent relative gene expression levels of IgG, NFκB-1, TLR-2, -3, -4 and -9, respectively, in OC- 3-VGH ovarian and/or C-33A cervical cancer cells upon separate treatments with RP215 and anti-human IgG and are plotted for correlation analysis. The correlation coefficients (R2) for treatments between these two antibody ligands were determined to be R2=0.9467. |