|
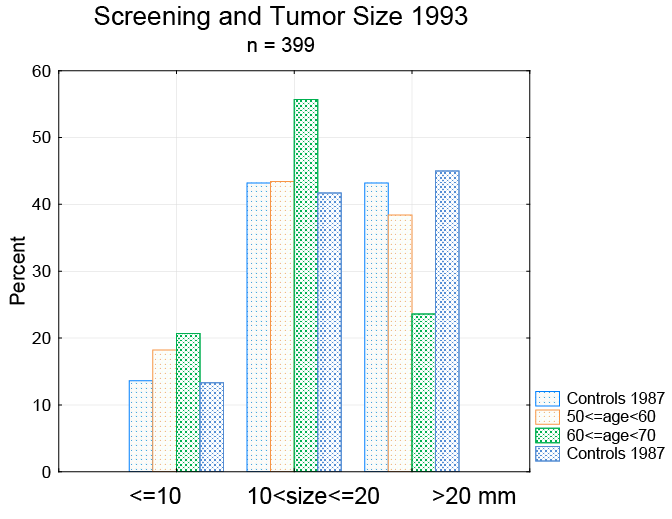
| Figure 1: Tumor size data from 1993, 4 years after the introduction of screening, representing a maximum of three screening events. Compared with prescreening control data, in the 60–70 year age group there is a significant reduction in tumors >20 mm (p<0.001) and a significant increase in intermediate-sized tumors (10–20 mm) (p<0.05). The control data are shown for the age group 50–59 years to the left and the age group 60–69 years to the right. |