 |
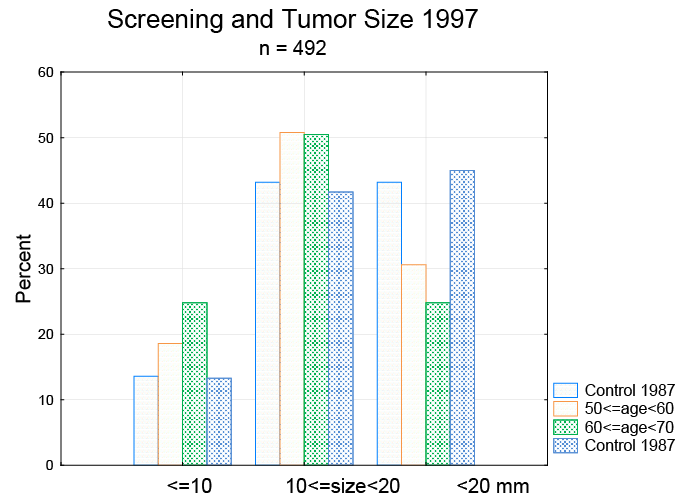
| Figure 3: Tumor size data from 1997, 8 years after the introduction of screening, representing a maximum of five screening events. Tumors>20 mm are still significantly less frequent in the study age group 60–69 years than in the 1987 controls (p< 0.001). In the 50–60 year age group it approaches significance (p=0.06). The frequency of small tumors (≤ 10 mm) is significantly greater in the 60–69 year age group than in the controls (p< 0.05). The control data are shown for the age group 50–59 years to the left and the age group 60–69 years to the right. |