 |
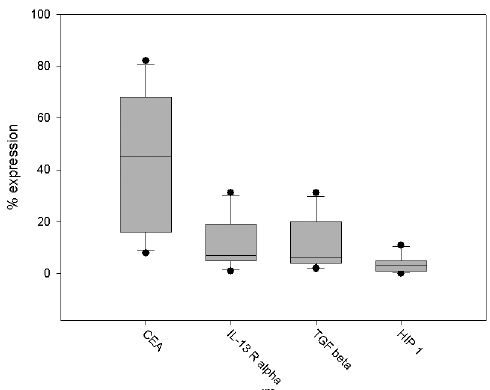
| Figure 3: Expression of TAA. The percentage of cells expressing general and GBM specific TAA as CEA, IL-13Rα, TGF-β and HIP1 is depicted in the boxplot graphic. The grey box represents middle 50% of values; the line in the box is the median expression; whiskers indicate the range of the data set; outliers are plotted as dots. |