 |
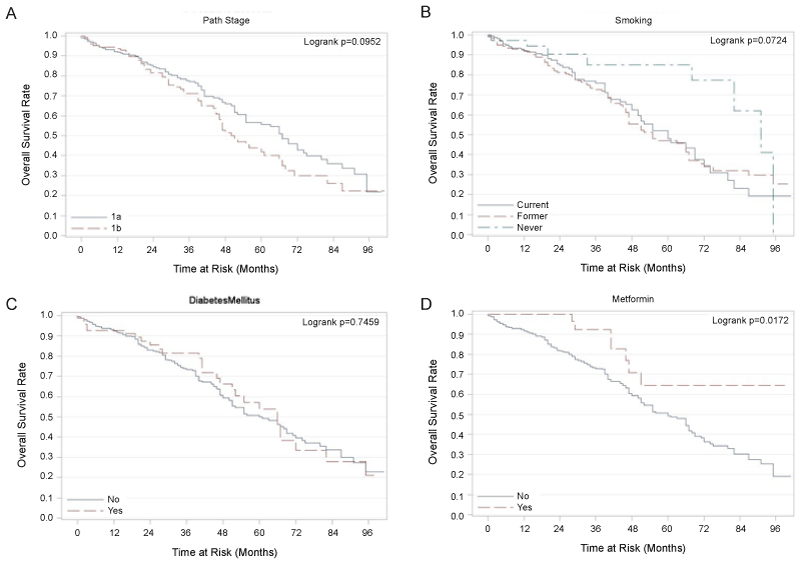
| Figure 1: Kaplan-Meier Plots of Overall Survival (OS) Rates. Panel A-Kaplan-Meier plot of overall survival with stage (IA and IB). Panel B-Kaplan-Meier plot showing a trend toward better survival of never smokers compared to current/former smokers (P=0.07). Panel C-Kaplan-Meier plot showing no difference in OS in patients with and without DM. Panel D-Kaplan-Meier plot showing significantly better OS in patients on metformin compared to those not on metformin (P=0.02). |