 |
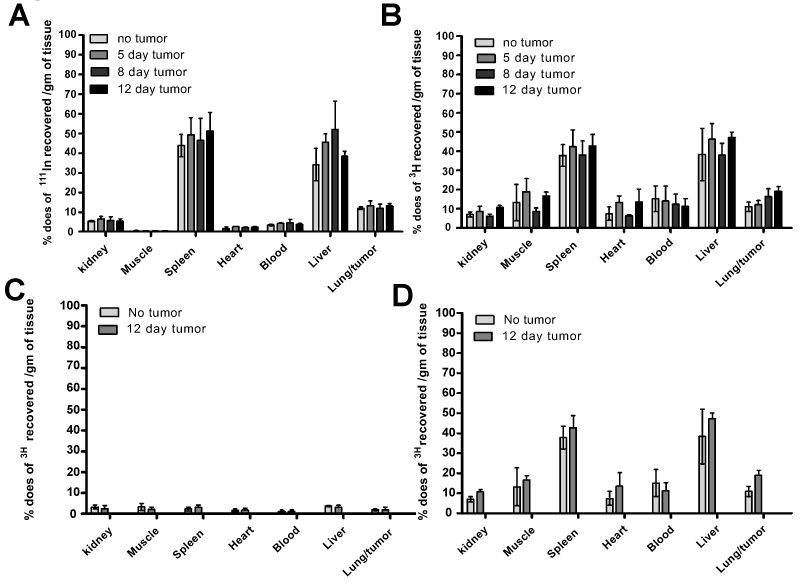
| Figure 5: Biodistribution studies using a dual labeling approach: The Y-axis represents the percent dose of 3H isotope recovered per gram of tissue, 3 hours following i.v. administration of either the [111In PCLs (3H-colchicine)] or 3H-colchicine. 111In was used to track the PCLs (A), and 3H was used to track the colchicine incorporated in PCLs (B). As measured by this dual radiolabeling approach, A and B show co-localization of 111In and 3H representing PCLs and colchicine, respectively in PCLcolchicine treated mice. C and D show biodistribution of [111In PCLs (3H-colchicine)] in tumor-bearing mice in comparison to free drug, 3H-colchicine. Y-axis shows the percent dose of 3H isotope recovered per gram of tissue for 3H-colchicine treated mice (C) and PCL-3H-colchicine treated mice (D). |