|
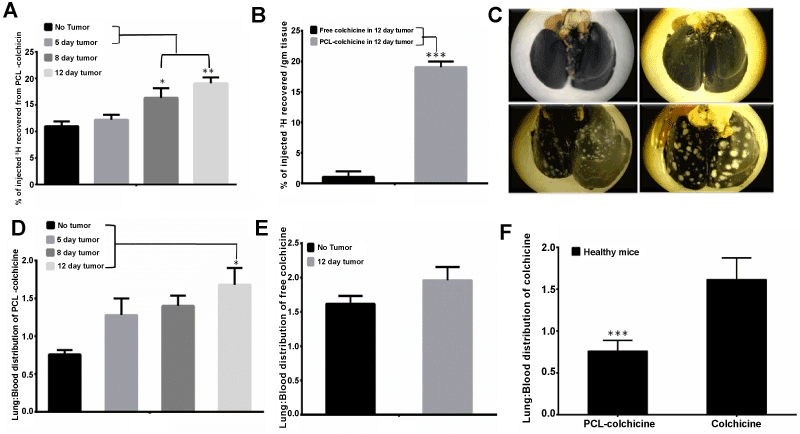
| Figure 6: A) Percent of injected dose of 3H-colchicine recovered from tumor-bearing mice of different ages administered with [111In PCLs (3H-colchicine)]. Each bar represents the average data from 5 mice. One way ANOVA with Bonferroni’s post hoc test was employed for the statistics. * (p < 0.05), ** (p < 0.01) indicates a significant increase in accumulation of PCL-colchicine in the 12 day old tumor compared to 5 day old tumor and no tumor group respectively. 95% CI of 0, 5, 8 and 12 day old tumors were 8.4 to 13.4, 9.5 to 14.79, 11.3 to 21.8 15.9 to 22.1, respectively. B) The percent of injected dose of 3H-colchicine recovered in 12 day old tumors administered with [111In PCLs (3H-colchicine)] or 3H-colchicine. Two tailed- Unpaired t-test was employed for the statistics. *** indicates p < 0.0001 and 95% CI was determined to be -21 to -14.96. C) Images of harvested lungs (black) showing tumor nodules (white) at different days. Top left: healthy lung; Top right: 7 day old tumor, Bottom left: 10 day old tumor; Bottom right: 15 day old tumor. D) The tumor to blood ratio of distribution of [111In PCLs (3H-colchicine)] between tumors of different ages; Y-axis shows the percent dose of 3H-colchicine injected in each group. One way ANOVA with Bonferonni’s post hoc test was employed for the statistics. An asterisk* indicates a significant increase (p=0.0125) in the accumulation of PCL-colchicine in the 12 day old tumor (95% CI-1.06 to 2.29) compared to the no tumor (95% CI – 0.6 to 0.9) group. E) The tumor to blood ratio of distribution of 3H-colchicine in 12 day old tumor versus healthy lung (95% CI -0.86 to 0.1761). Y-axis shows the percent dose of 3H-colchicine recovered in each group. Two tailed- unpaired t-test was employed to determine the p value (0.1761). F) The lung to blood ratio of 3H-colchicine recovered from mice administered with either [111In PCLs (3H-colchicine)] or 3H-colchicine, the unpaired t-test was carried out with welch’s correction; *** indicates p=0.0006, with 95% CI 0.4 to 1. |