 |
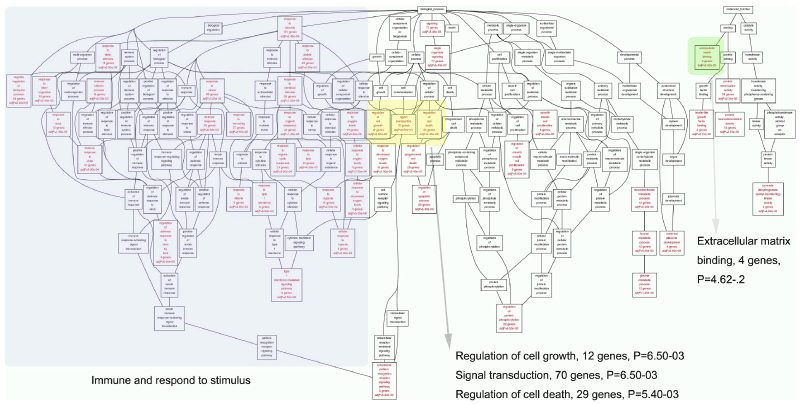
| Figure 1: GO enrichment of differentially expressed genes from the mRNA expression profile of Ezrin knockdown was performed by the WebGestalt webserver. The enriched GO terms are visualized using a graphical representation with red color coding reflecting the significant enrichment, while those in black are non-enriched parents. Listed in the boxes is the name of the GO category, the number of genes in the category and the P-value indicating the significance of enrichment. |