 |
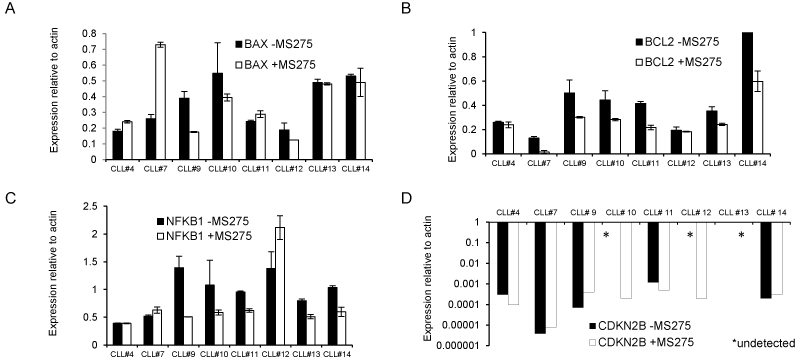
| Figure 4: The effects of MS275 treatment on the expression of selected genes. (A-E) Real-time PCR analysis of untreated and MS275 treated primary CLL specimens for BAX, BCL2, NFKB, and CDKN2B RNA expression. All data is adjusted to actin (mean and SD). |