|
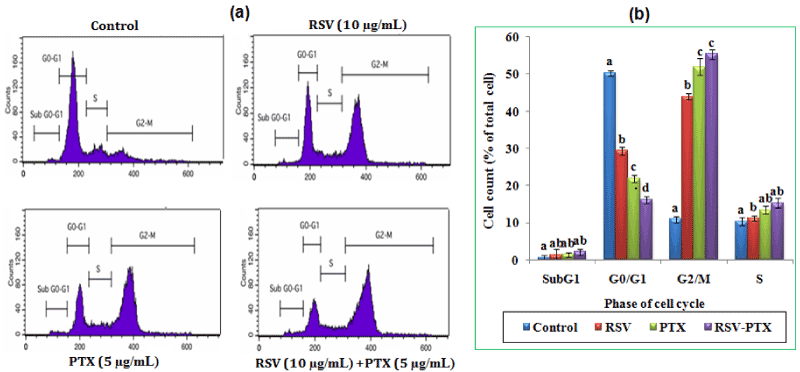
| Figure 6: Effect of RSV-PTX on cell cycle and apoptosis (a) NCI-H460 cells were treated with RSV, PTX or RSV-PTX. RSV-PTX was able to increase the proportion of cells in G2/M as compared to RSV alone or PTX alone treated cells. (b) The bar graphs show the cell cycle distribution and the percentage of cells in each phase; these were obtained by calculation using the CellQuest software. Values not sharing a common marking (a, b, c) differ significantly at P<0.05 (DMRT). |