 |
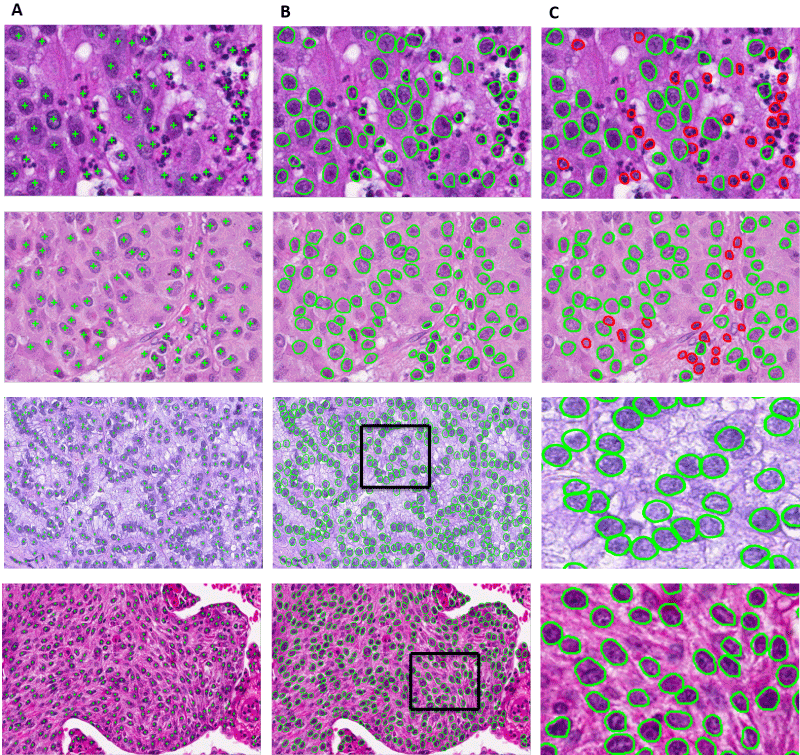
| Figure 2: (A) Cell/seed detection results. (B) Cell segmentation using the previous detected seeds as initialization. (C) First 2 rows: Based on the cell segmentation results, we used a threshold on cell area to eliminate the nontumor cells (those with red contours). Last 2 rows: The zoomed-in patches of the corresponding regions (marked with black rectangles) in column 2. |