 |
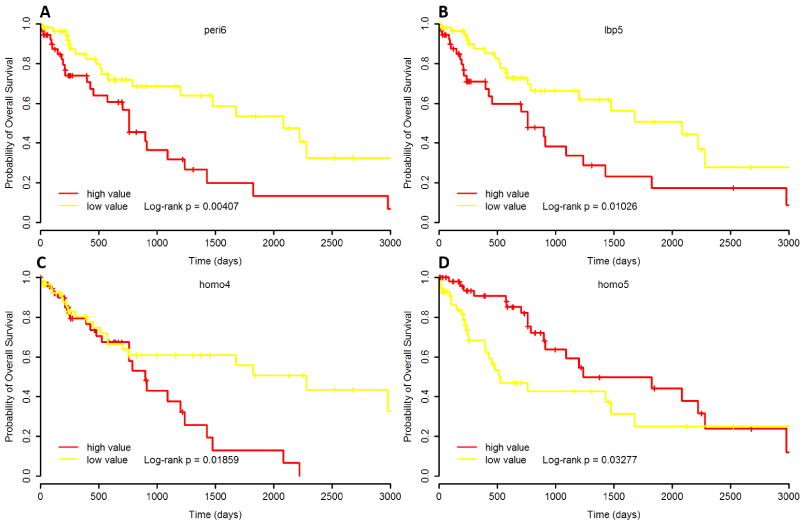
| Figure 5: Kaplan-Meier survival curves of four top features. (A) peri-6; (B) lbp-5; (C) homo-4; (D) homo-5. The cases with high value show significantly worse overall survival than those with low risks based on all the four features (log-rank P <0.05 in all the analyses). |