 |
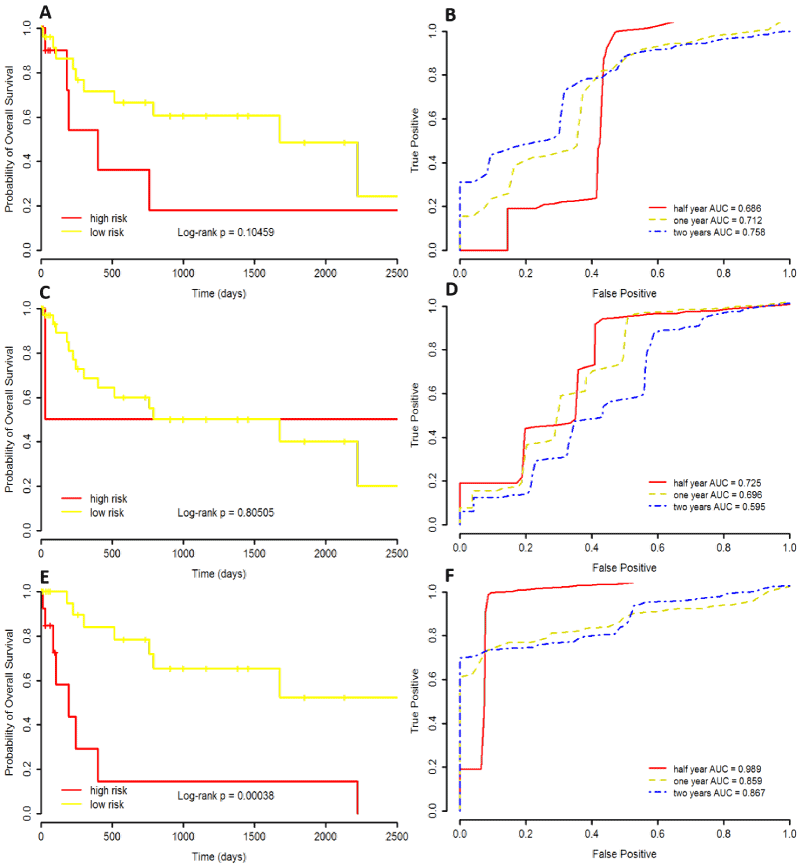
| Figure 6: Prediction of risk scores on three reduced model. (A) Kaplan-Meier survival curves in geometry features; (B) ROC curves in geometry features; (C) Kaplan- Meier survival curves in pixel intensity features; (D) ROC curves in pixel intensity; (E) Kaplan-Meier survival curves in texture features; (F) ROC curves in texture features. |