 |
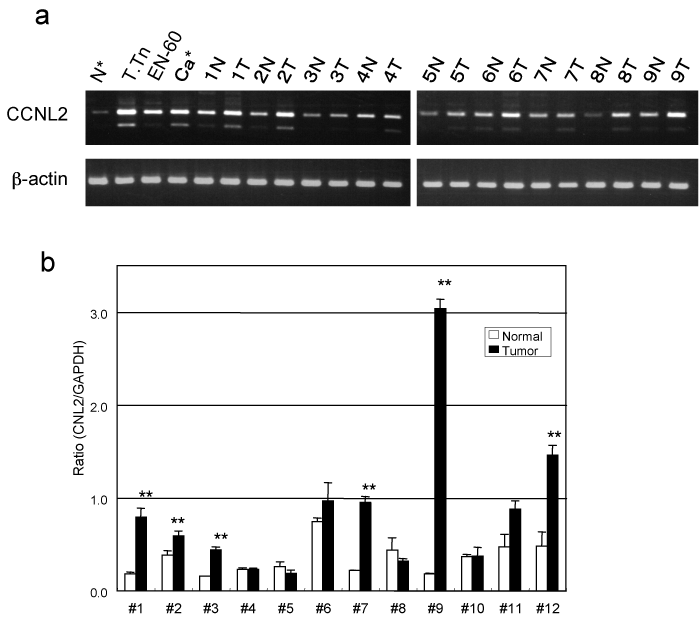
| Figure 3: The expression of CCNL2 mRNA in normal and esophageal SCC tissues. a, The expression of CCNL2 (upper panel) and b-actin (lower panel) was examined by RT-PCR for specimens of normal (N) and carcinoma (T) tissues resected from patients 1 to 9. N* and Ca* represent the products from RNA of normal esophageal keratinocytes and esophageal SCC, respectively, obtained from Cybrdi. T.Tn is a human esophageal SCC cell line, and EN-60 is an immortalized human esophageal keratinocyte. b, The expression of CCNL2 mRNA was examined by RT-qPCR in specimens of normal and esophageal SCC tissues resected from patients 1 to 12 (#1 - #12). Each value was normalized with that of GAPDH, and the averages of three experiments are shown. The error bars represent SD (n = 3).Asterisks indicate a significant increase in carcinoma tissues as compared to normal tissues (**, p < 0.01, Student’s t test). |