 |
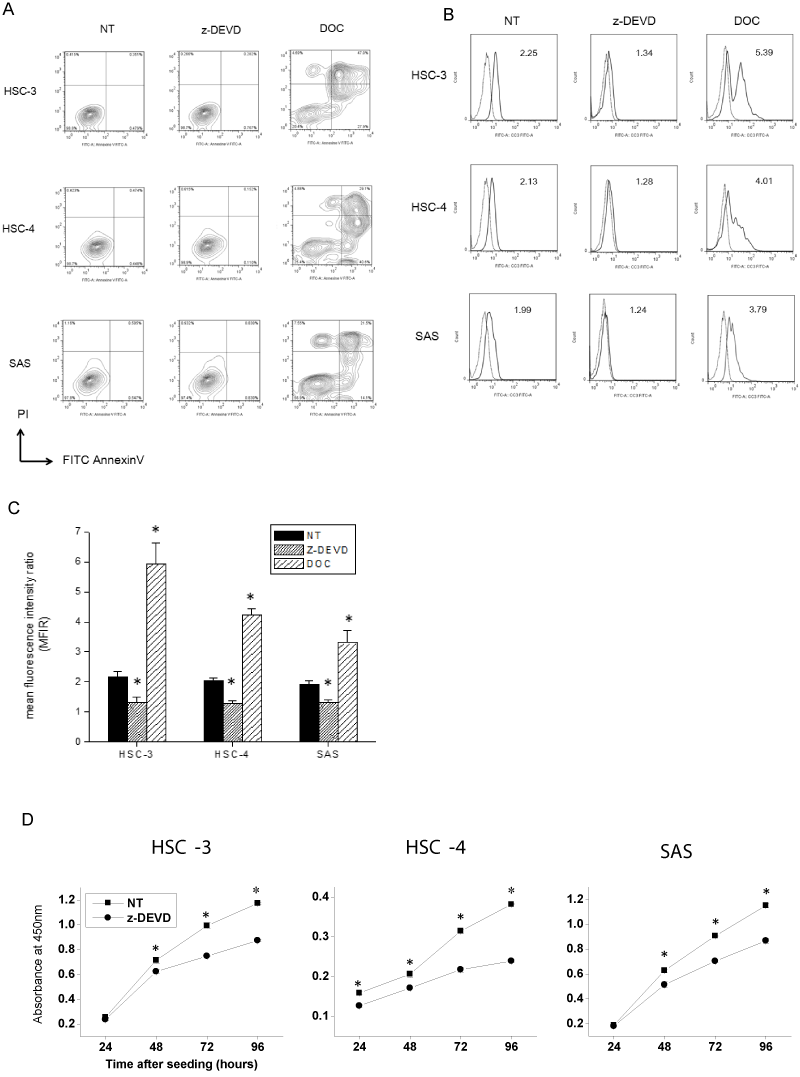
| Figure 3: Cleavage activity of caspase-3 was observed in oral squamous cell carcinoma (OSCC) cells without apoptosis. (A) Analysis of apoptotic cell death in OSCC cell lines. OSCC cells were grown in culture medium with 10% fetal bovine serum (FBS). Control cells for caspase-3 inhibition were treated with 200 μmol/L caspase-3/7 inhibitor z-DEVD-fmk for 12 h. The control cells for apoptotic cell death were treated with 50 μM docetaxel for 12 h. The cells were then examined by staining with both Annexin V and propidium iodide (PI). The X-axis represents the Annexin-related fluorescence and the Y-axis represents the PI-related fluorescence. The cells in the lower right and upper right represent early apoptotic cells and late apoptotic cells, respectively. (B) Analysis of active caspase-3 in OSCC cell lines by flow cytometry. The OSCC cells were grown in culture medium with 10% FBS. The control cells for caspase-3 inhibition were treated with z-DEVD-fmk for 12 h. The control cells for apoptotic cell death were treated with 50 μM docetaxel for 12 h. The cells were then examined by intracellular staining with either isotype control antibody or anti-cleaved caspase-3 antibody. Experiments were performed in triplicate, and representative data from one experiment is shown. The dashed lines represent staining with the isotype control antibody. Solid lines represent staining with the anti-cleaved caspase-3. The number in each panel represents the mean fluorescence intensity ratio (MFIR). (C) The mean ± SD of the fluorescent intensity of the cleaved caspase-3 was analyzed. An asterisk indicates a significant difference in the MFIR compared with the non-treated cells in each cell line. (p < 0.05); NT, nontreated; DOC, docetaxel. (D) Growth inhibitory effect of caspase-3 inhibition on OSCC cells. The OSCC cells were incubated in the absence or presence of z-DEVD-fmk, and the time course of proliferation of adherent OSCC cells was measured by the WST-1 cell proliferation assay system. The mean ± SD from sextuplicate determinations are shown. An asterisk indicates a significant difference between two groups. (p < 0.05) |