 |
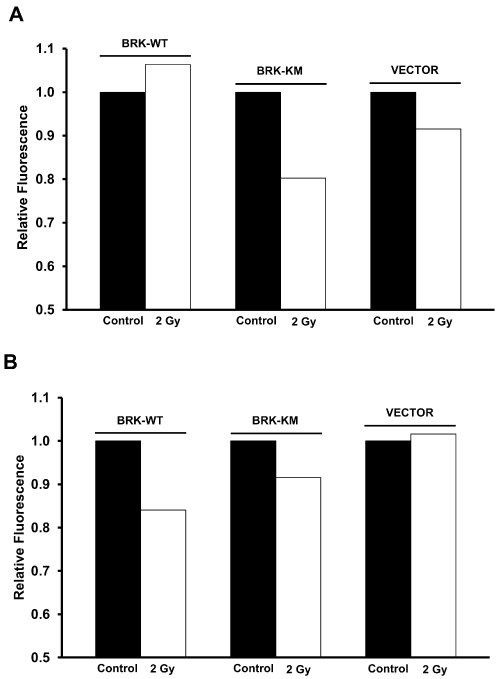
| Figure 3: A and B Show the total level of ATM protein in the cell lines in untreated cells and in those directly following their exposure to 2 Gy gamma radiations. Data are derived from analysing the nuclear intensity of fluorescent immunostaining of the ATM protein derived from imaging flow cytometry of at least 10,000 cells. Figure 3A shows the ATM protein in the MDA-MB-157 cell lines and Figure 3B for the MDA-MB-468 cell lines. |