 |
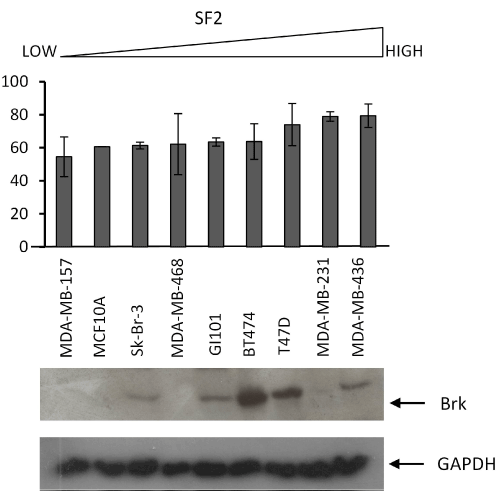
| Figure 6: Shows the levels of Brk expression related to SF2. Clonogenic assays were carried out to calculate the SF2 for each cell line (shown in the graph). Equal cell numbers were loaded onto an SDA-PAGE gel and Brk levels detected by western blotting (lower panels). Anti-GAPDH was used as a loading control. |