 |
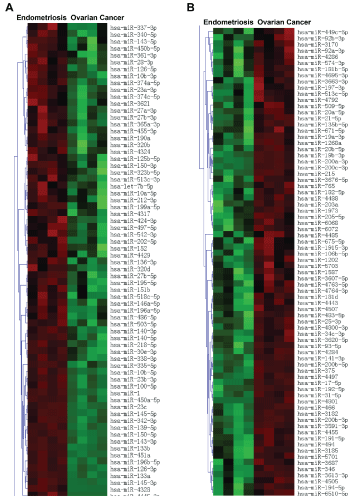
| Figure 2: Heatmap of clustering miRNA microarray data with columns arranged according to hierarchical clustering method. miRNA groups that are increased in endometriosis compared to ovarian cancer (A). miRNA groups that are reduced in endometriosis compared to ovarian cancer (B). |