 |
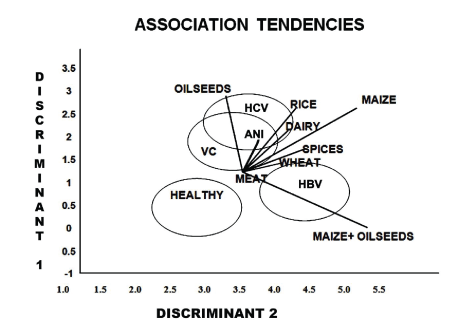
| Figure 3: The association shows a circle for each group and axis for each reported food. If a circle is in the direction of an axis, that group has more reported consumption of the food of the axis. The Healthy group was moderated in the reported consumption of all foods; Hepatitis C Virus (HCV) reported to consume more dairies, meats and oil seeds; Viral cirrhosis (VC) more oilseeds; Hepatitis B Virus (HBV) reported to eat more cereals and oil seeds. The food reported consumption of the HCV and VC groups were very similar. Ani=Animal derivates, meat and eggs, were not so significant. |