|
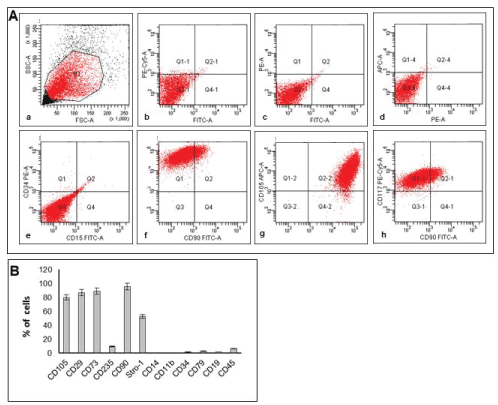
| Figure 2: A: Surface antigenic profile of BMMCs obtained from bone marrow aspirates at the first culture passage analyzed by FACS. a: BMMCs control. b-d: FACS setting with fluorochromes. e: CD34 and CD15 surface antigens co-expression characterization. f: 85.7% of BMMCs expressed CD90 antigen. g: 95.1% of cells expressed CD105. h: co-expression of CD90 and CD117 antigens. B: percentage of positive cells to other antigens such as CD14, and CD11b as indicated. |