 |
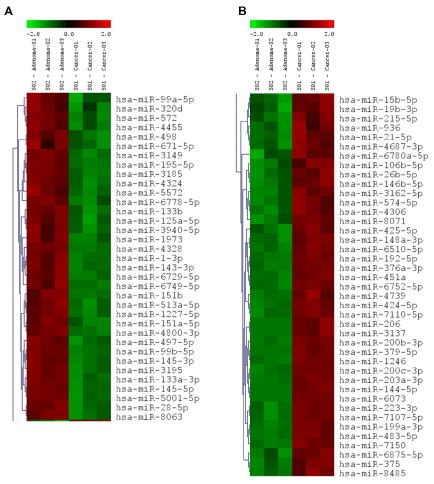
| Figure 2: Heatmap of clustering miRNA microarray data with columns arranged according to the hierarchical clustering method. The miRNA groups that are decreased in the mucinous cystadenocarcinoma (Cancer) (A). The miRNA groups that are increased in the mucinous cystadenocarcinoma (Cancer) (B). |