 |
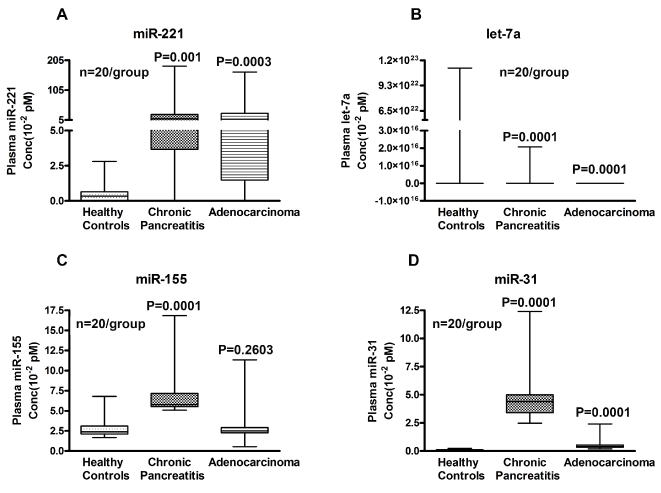
| Figure 5: Comparative expression analysis of miR-221 (5A), let-7a (5B), miR-155 (5C) and miR-31 (5D) from plasma samples of HC, CP and PC quantitated individually using qRT-PCR (n=20/group). In miR-221, there appears to be an increase in the expression in CP and PC compared to HC, suggesting an oncogenic role of miR-221 (5A). In contrast, the expression of let-7a was significantly decreased in PC compared to both HC and CP patient’s plasma samples indicating a tumor suppressor role of let-7a (5B). Both miR-155 and miR-31 expression was mostly found to be up-regulated in CP patient samples followed by PC and primarily lower expression was found in HC plasma (5C&5D). The plasma miRNAs concentration was calculated using the standard miRNA concentration in 10-2 pM units using the Quantity value *3.125/6.02/1000. P values represent comparison between HC vs CP and HC vs PC using t-test. |