|
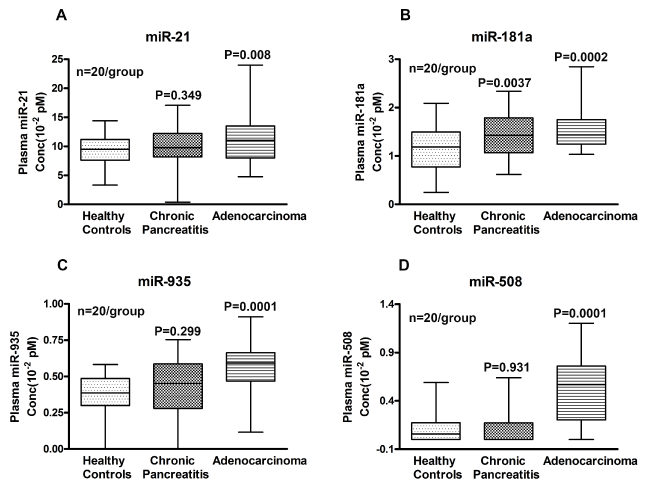
| Figure 6: Comparative expression analysis of miR-21 (6A), miR-181a (6B), miR-935 (6C) and miR-508 (6D) in plasma samples of HC, CP and PC subjects quantitated individually using qRT-PCR (n=20/group). There appears to be a gradual increase in the expression in CP and PC compared to HC in all four miRNAs as presented in Figure 6. The plasma miRNAs concentration was calculated using the standard miRNA concentration in 10-2 pM units using the Quantity value *3.125/6.02/1000. P values represent comparison between HC vs CP and HC vs PC using t-test. |