 |
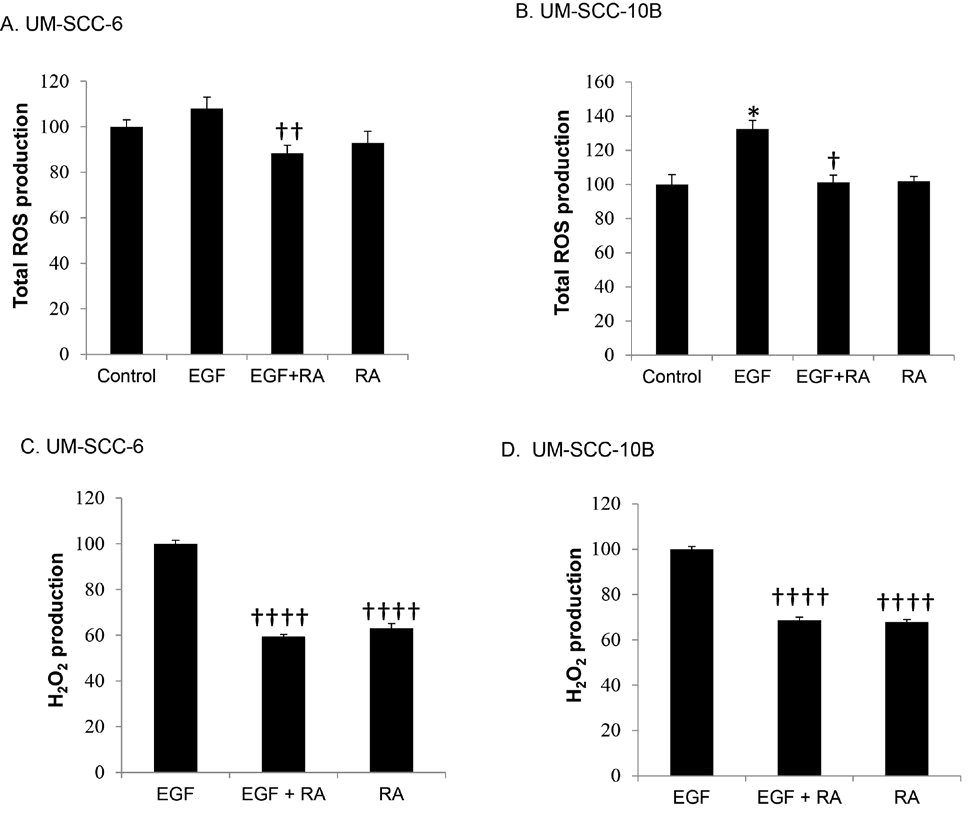
| Figure 7: Effect of RA on EGF–induced total ROS and H2O2 production. Cells were pretreated with RA for 30 minutes followed by stimulation with EGF. Then, cells were incubated with CM-H2DCFDA for 40 min. Total ROS production was determined in UM-SCC-6 (A) and UM-SCC-10B (B) by measuring fluorescence at excitation 485/20 and emission at 528/20. Data are expressed as mean ± SD (n = 5). *p<0.05 vs control. †p<0.05, ††p<0.01 vs EGF. To measure H2O2 production, cells were treated with RA for 2 h and then stimulated with EGF for 5 minutes. The amount of H2O2 was detected in UM-SCC-6 (C) and UM-SCC-10B (D) using the Amplex™ peroxide assay. Data are expressed as mean ± SD (n = 5). ††††p<0.001 vs EGF. |