|
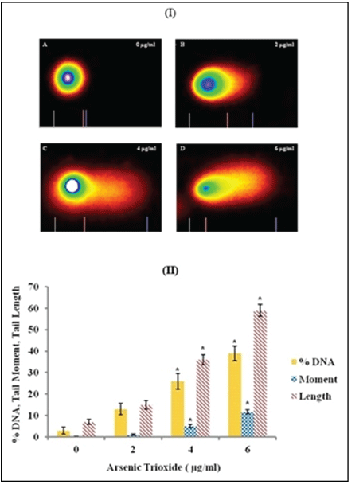
| Figure 6: (I) Representation of Comet assay images of A549 cells treated with ATO at 0 µg/ml (A); 2 µg/ml (B), 4 µg/ml (C), and 6 µg/ml (D) after 48 hr of exposure. (II) DNA damage in A549 cells treated with arsenic trioxide. The figure shows the percentages of DNA damage, olive tail moment and Comet tail length. |