 |
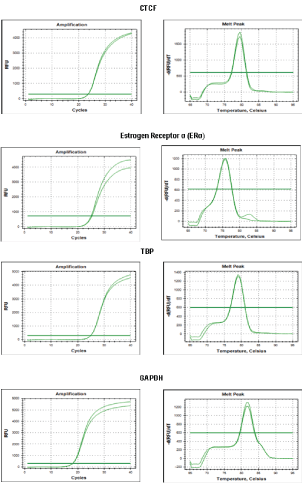
| Figure 4: Assessment of QPCR replicate consistency and melting curves. MCF7 cDNA (reverse transcribed from 1 μg of RNA) at 1:5 dilution was amplified in duplicates by QPCR using CTCF, estrogen receptor (ER) α, TATA box protein (TBP) and GAPDH primer pairs respectively. The amplification curve indicating replicate consistency for each primer pair is shown. Also shown is the single peak melting point for each primer pair indicating the absence of nucleic acid contamination? |