 |
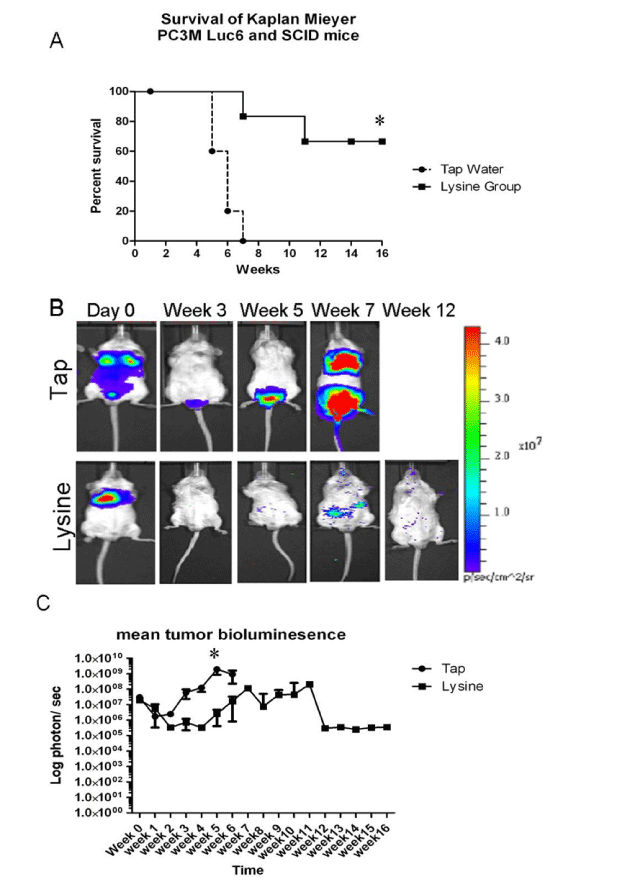
| Figure4: Effect of lysine on survival, and tumor burden A) Kaplan Meyer Survival Curve illustrating that the animals treated with lysine survived significantly (p<.002) longer than the tap cohort. B) Representative bioluminescence images demonstrating little tumor burden present in the lysine animal as compared to the tap animal. C) The lifetime average tumor burden of two cohorts, showing that all tap animals had to be euthanized after 6 weeks,while only two of the six lysine animals developed measureable metastases. |