 |
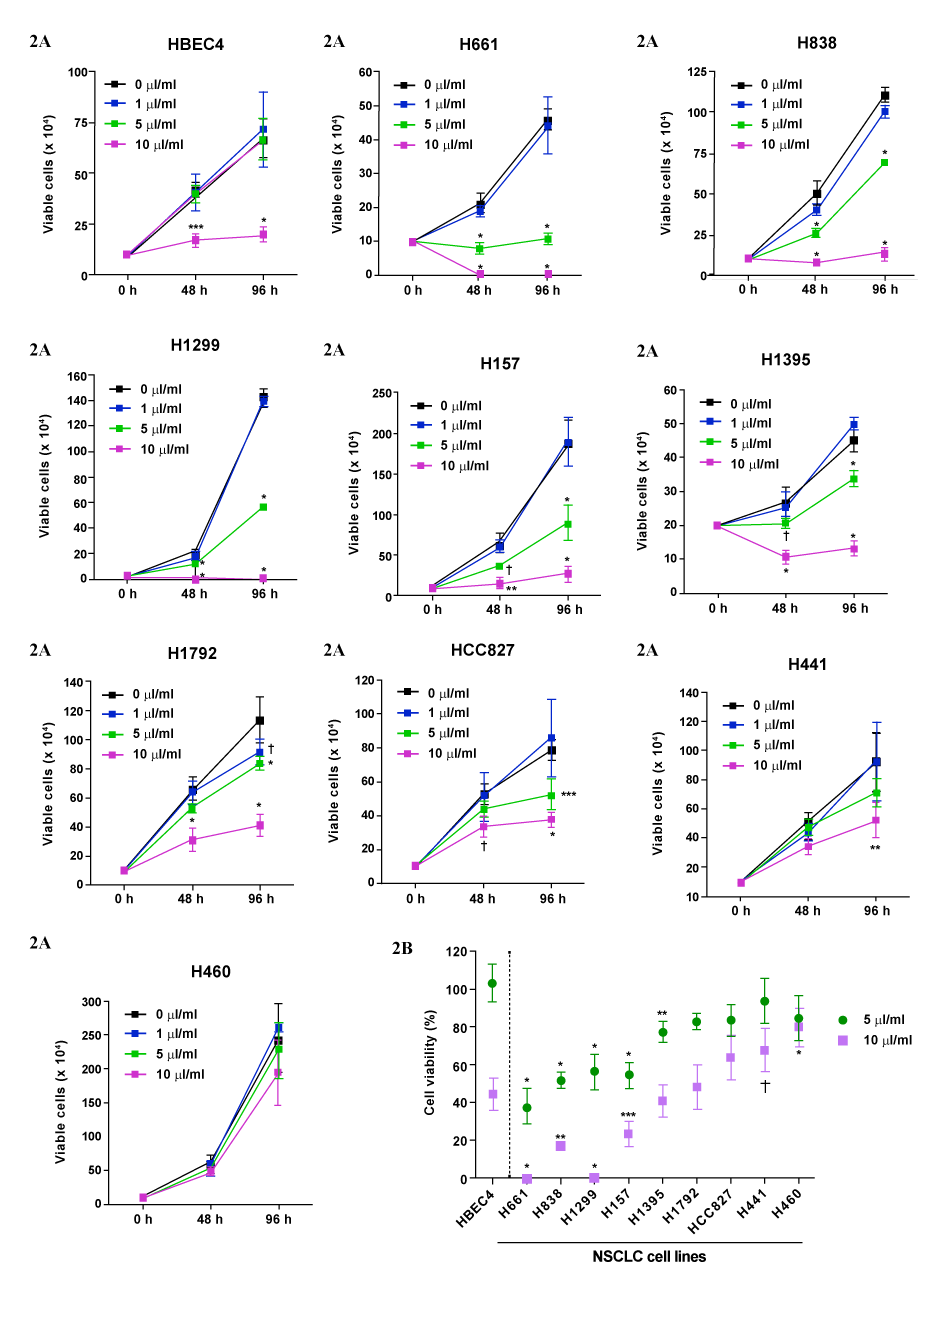
| Figure 2: (A) The effect of MK615 on the in vitro cell growth of nine NSCLC cell lines and the HBEC4 immortalized bronchial epithelial cell line, which serves as a non-cancerous control. *, P<0.0001; **, P<0.001; ***, P<0.01; †, P<0.05 for comparisons with the non-treatment control (0 μl/ml) by ANOVA using Bonferroni multiple comparisons. The dots represent the mean ± SD from four independent experiments. (B) The cell viabilities (%) of nine NSCLC cell lines and the HBEC4 cell line at 48 h post 5 μl/ml and 10 μl/ml MK615 treatment. *, P<0.0001; **, P<0.01; †, P<0.05 for comparisons with the HBEC4 cell viabilities by ANOVA using Bonferroni multiple comparisons. The dots represent the mean ± SD from four independent experiments. |