|
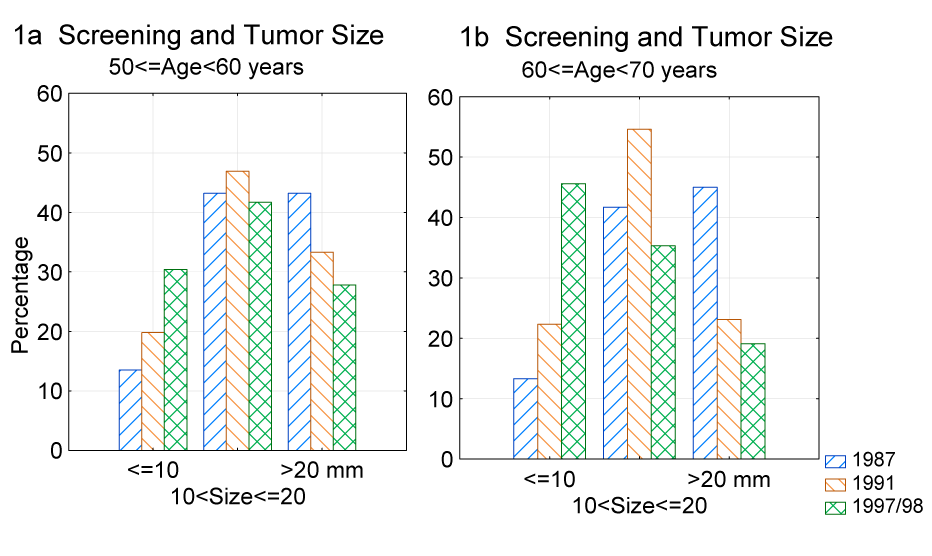
| Figure 1: A) Relative distribution of tumor size over three increasing intervals for two mammography screened groups and controls of women aged 50−60 years are shown. Bars represent the percentage for size intervals. For tumors ≤10 mm, the 1997/98 sample increased significantly from the control sample of 1987 (P <0.01) and in the large group ( ≥20 mm) the tumor size has decreased significantly (p<0.01). B) In the small size group (≤10 mm) the difference has increased further between the screened sample from 1997/98 and the control (P<0.001) and in the large group (>20 mm) the comparison is also stronger (P<0.001) In the middle size interval the 1991 sample differ significantly both to the control sample (p<0.05) and the 1997/98 sample (p<0.01). In the 1991 sample the large group (>20 mm) decreased significantly related to the control (p<0.001). |